What is a network graph?
A network graph is a digital diagraming tool that can be used to visually represent the relationships that exist within research data by expanding on current digital tools like OCR, text-mining and mapping. A network graph relies on digitized data, nodes and links to create visual interactives and representations of the given information. From these visualizations, researchers can interpret the patterns that exist in the information. Notably, researchers can use their research data in software like Palladio to create a deeper understanding for their subject matter as well as to determine the relevant connections and inquiries that exist within and from the data.
Wait? What is Palladio?
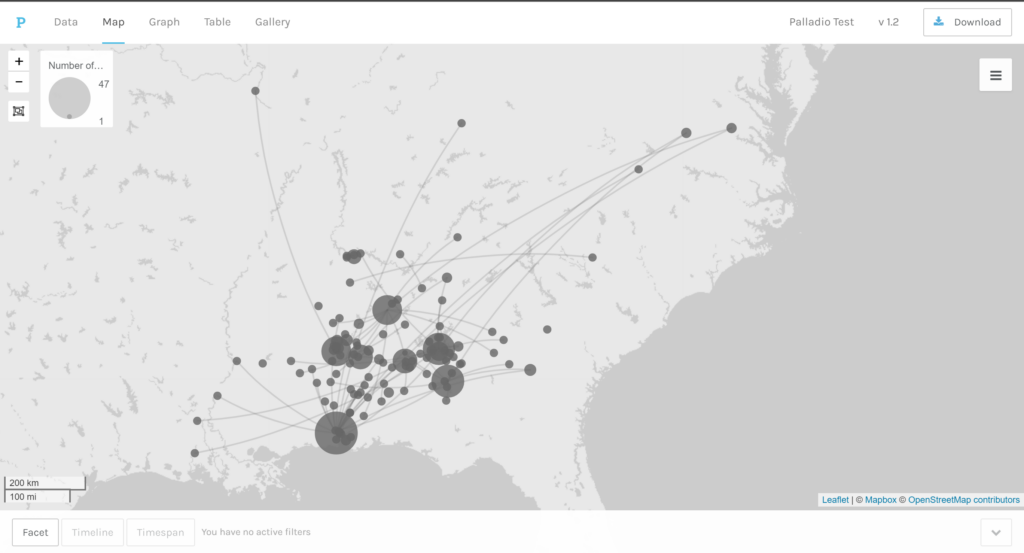
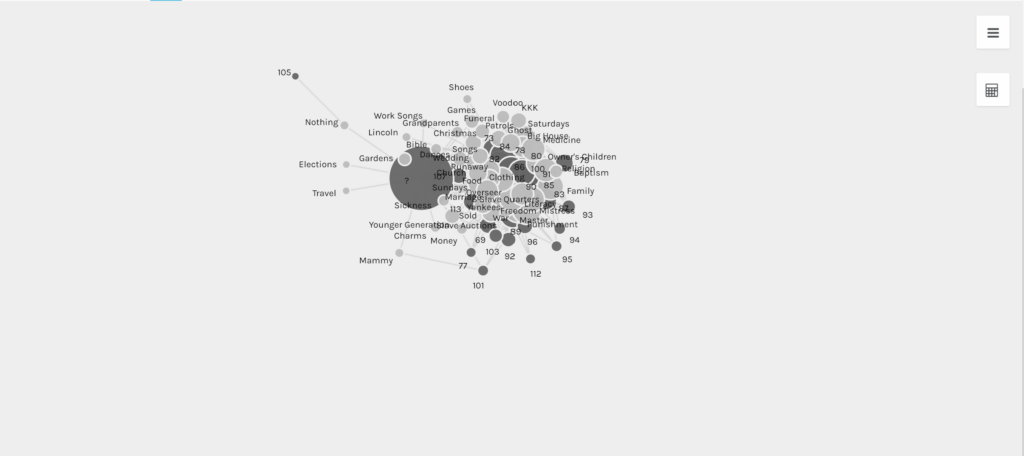
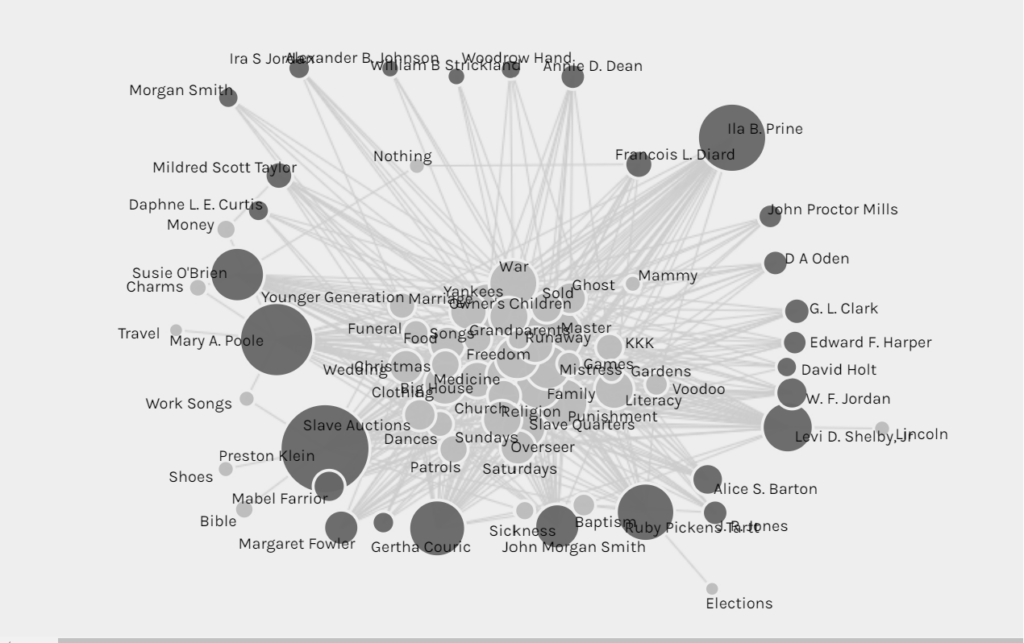
Palladio is a software tool that enables researchers to upload relevant research data from a .csv or spreadsheet that can be networked within the software. From there, Palladio can create visual interactives using nodes and links based on the dimensions, layers, sources, targets and facets set by the user. In my test run of the software, I uploaded data from the WPA slave narratives project. I was able to filter my network graphs based on my selected dimensions such as M/F (Male/Female), Type of Work, Interviewer, Topics, Age, When interviewed and so on. As a result, I was able to see the connections and patterns that existed within the data. For instance, I used the network graph to see that there was a large node associated with ages that were unknown to the interviewers. This led me to the conclusion that many of the former enslaved had no idea what their age was based on a lack of record keeping that occurred on plantations for the enslaved.
How have network graphs been used?
Network graphs have also allowed scholars to explore the connections and inquiries associated with the reprinting of texts in the nineteenth century (the Viral Texts Project), the correspondence of Enlightenment thinkers (Mapping the Republic of Letters) and the personal relationships of Jazz musicians (Linked Jazz). The Viral Texts Project demonstrates the culture of reprinting in the nineteenth century as well as the popularity of certain texts and themes in that period of time. Comparatively, the Mapping the Republic of Letters project allows scholars to see the transference of ideas that emerged with the correspondence and relationships of certain historical figures. Similarily, the Linked Jazz project diagrams the relationships of various Jazz musicians by linking documents and data from archives, libraries and museums. Understandably, network graphs enable scholars to learn new insights on the research they currently have.