How to Read Crowdsourced Knowledge

Using Wikipedia:
Wikipedia offers its users a unique opportunity to explore the talk and history pages of its articles. The exploration of the talk and view history pages gives users transparency on the creation of Wikipedia articles. Users can ultimately gain insight on the dialogue contributors have on article creation as well as the revising and editing process of Wikipedia pages.

This is the current Wikipedia page for the Digital Humanities. Under the article heading, users can access the “talk” feature to see what dialogue occured with contributors overtime. In the far right, users can access the articles “view history” to see what changes the article had overtime.
The “talk” feature allows users to see the discussions Wikipedia contributors had overtime in relation to the Digital Humanities article.

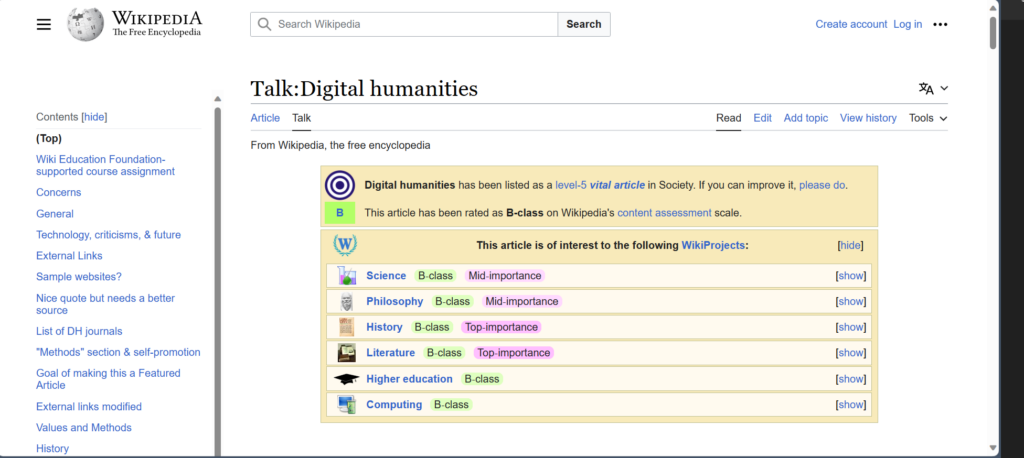
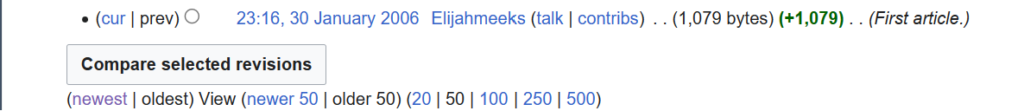
I utilized Wikipedia’s talk and history features in my exploration of Wikipedia’s digital humanities’ article. The talk feature allowed me to see the discussions contributors had over the content that was written. There were apparent issues related to the article’s organization. The article also had numerous contributors who engaged in a dialogue on making improvements to the article’s quotations, external links, neutrality, definitions and so on. Users are also allowed to view the biographies of the contributors. For instance, Skirden and Hectorlopez17 were top contributors for the current digital humanities article. They were both associated with Wikipedia projects like Wikipedian in Residence and the Electronic Textual Cultures laboratory. If the information is public, users can see the identified credentials of the key contributors and their associations. In regard to the history, I could see that the article was first created on January 30, 2006 by contributor Elijahmeeks. Since 2006, the page has evolved to include more information related to the digital humanities such as its definition, history, cultural relevance, project purpose, values and methods, criticism, references and external links.

In the view history, users can see when an article was made. In this case, Wikipedia’s digital humanities article was made on January 30, 2006 by contributor Elijahmeeks.

That said, Wikipedia is not entirely perfect. It is open source which means anyone can access its entries. But, its transparency with features like their talk and history pages enables users to see how ideas related to their articles have changed overtime; therefore, enabling a reliance on user judgment.

Using AI:
Just like Wikipedia, Artificial Intelligence programs are not without their own problems and possibilities. Programs like ChatGPT have weaknesses in citing the location of information they utilize in their response. ChatGPT also generates fictional data points when it does not have enough information to answer an unfamiliar question. ChatGPT also has the potential to oversimplify complex issues due to a lack of human input as it is an AI. However, these flaws can be improved with the implementation of human feedback and plug-in creation.

I used ChatGPT to define the digital humanities. It gave me an extensive answer but did not provide citations for the given response.

According to Jon Gertner, AI companies have made moves to correct AI misinformation by using reinforcement learning with human feedback while the Wikimedia Foundation has created a Wikipedia based plug-in to redirect ChatGPT to Wikipedia for further information on a subject matter. For the most part, AI has the potential to work with users to answer questions in a conversational format that can initiate deeper inquiries into various subject matters. Also, the proposed improvements for AI can lead users into carrying their own scholarly research once AI can provide the necessary citations.

Comparing Tools

Software tools like Voyant, kepler.gl, and Palladio can be used to create visual rerepresentations of research findings. The tools expand on existing computational methods and techniques. These existing computational methods include textmining, mapping and network analysis. Amongst other similarities, Voyant, kepler.gl, and Palladio can be used to demonstrate the relationships that exists within the research data. Users can upload their digitized research data into the given software to create visualizations of the data. The visualizations will then enable the data to be interpreted and analyzed. However, software tools vary in how they can visually enhance information and what digitization techniques can be used collaboratively. 

Voyant is preferred when textmining data. Voyant enables users to upload links of textual information into data sets to be processed into a digital corpus. The digital corpus can then be modified into Voyant’s visual interactive tools like Cirrus, Reader, Trends, Summary and Contexts. For example, I filtered data from the WPA slave narratives to compare the frequency of words in various states. I was then able to conduct a textual analysis of distinctive words based on location. From these tools, users can conduct data analysis to determine relevant patterns and relationships. 

Comparatively, kepler.gl is a digitized mapping tool. Users can utilize features like points, clusters and heat maps to enhance uploaded data. The assortment of maps enable the exploration of data point density to illuminate the significance of certain locations. Kepler.gl also offers features like category maps and timelines to demonstrate the changes and continuities that exist over time in a data set. Kepler.gl also enables data differentiation. I was able to use kepler.gl to differentiate the different jobs the enslaved (identified in the WPA slave narratives) were assigned. I was also able to use the timeline feature to see changes in the data overtime to examine the relationships between various locations and their significance in Alabama. 

Palladio, a digital network graphing tool, can also be used to create visual interactives. Users can upload data that can be networked within the software. Palladio allows its users to modify the dimensions, layers, sources, targets, facets, nodes and links of uploaded data.  With these modifications, users can evaluate the patterns and connections that exist in the data. In my usage of the WPA slave narratives, I was able to identify patterns in the data related to unknown ages of the interviewees by using the provided dimensions. 

Clearly, all three software tools are useful in showing the relationships and patterns that exist in uploaded data. But, they differ in what computational methods they can be best utilized. Voyant is preferred for textmining while kepler.gl and Palladio are useful for data mapping. Despite the differences, these three software tools can be used in collaboration to provide various visual interactives that can be used to confirm or deny patterns and continuities in the data. The given software can also be used to draw support for historical interpretations by drawing on the quantitative and qualitative evidence presented in textmining and mapping.

Network Analysis with Palladio

What is a network graph?

A network graph is a digital diagraming tool that can be used to visually represent the relationships that exist within research data by expanding on current digital tools like OCR, text-mining and mapping. A network graph relies on digitized data, nodes and links to create visual interactives and representations of the given information.  From these visualizations, researchers can interpret the patterns that exist in the information. Notably, researchers can use their research data in software like Palladio to create a deeper understanding for their subject matter as well as to determine the relevant connections and inquiries that exist within and from the data. 

Wait? What is Palladio?

This is the map tool that can be used on Palladio. Palladio allows its users to use nodes and links to highlight the relationships between locations in the data.

Palladio is a software tool that enables researchers to upload relevant research data from a .csv or spreadsheet that can be networked within the software. From there, Palladio can create  visual interactives using nodes and links based on the dimensions, layers, sources, targets and facets set by the user.  In my test run of the software, I uploaded data from the WPA slave narratives project. I was able to filter my network graphs based on my selected dimensions such as M/F (Male/Female), Type of Work, Interviewer, Topics, Age, When interviewed and so on. As a result, I was able to see the connections and patterns that existed within the data. For instance, I used the network graph to see that there was a large node associated with ages that were unknown to the interviewers. This led me to the conclusion that many of the former enslaved had no idea what their age was based on a lack of record keeping that occurred on plantations for the enslaved. 

This network graph demonstrates the relationship between the age of those interviewed (in the dark gray nodes) and the topics that are discussed (in light gray).
This network graph shows the relationship between the interviwers (in dark gray) and the topics that were discussed in the narratives (in light gray).

How have network graphs been used?

Network graphs have also allowed scholars to explore the connections and inquiries associated with the reprinting of texts in the nineteenth century (the Viral Texts Project), the correspondence of Enlightenment thinkers (Mapping the Republic of Letters) and the personal relationships of Jazz musicians (Linked Jazz). The Viral Texts Project demonstrates the culture of reprinting in the nineteenth century as well as the popularity of certain texts and themes in that period of time. Comparatively, the Mapping the Republic of Letters project allows scholars to see the transference of ideas that emerged with the correspondence and relationships of certain historical figures. Similarily, the Linked Jazz project diagrams the relationships of various Jazz musicians by linking documents and data from archives, libraries and museums. Understandably, network graphs enable scholars to learn new insights on the research they currently have. 

Mapping with Kepler.gl

Digital mapping can be defined as the methodology of using geospatial information to create visual representations of historically significant locations with the purpose of investigating historical processes and relationships (Presner and Shepard, 2016).  In other words, digital mapping allows researchers to discover the value of time and place for specific areas. According to Presner and Shepard (2016), mapping can be simply understood as “a kind of visualization that uses levels of abstraction, scale, coordinate systems, perspective, symbology, and other forms of representation to convey a set of relations” (p. 1). However, the digital humanities have revolutionized mapping from its most basic form to alternative and improved versions. For instance, mapping now includes historical mapping of “time layers”, linguistic and cultural mapping, conceptual mapping, community-based mapping as well as the use of technology to create visual interactives (Presner & Shepard, 2016). This revolutionization of mapping enables scholars to have a new method of research that can “test hypotheses, discover patterns, and investigate historical processes and relationships”(Presner & Shepard, 2016, p.8).

 Several projects have emerged in light of mapping advancements such as Photogrammar, Histories of the National Mall, and Mapping the Gay Guides. Each project expanded on the original understanding of its subject matter. Photogrammar reimagined the scale in which the Great Depression impacted most of America and not just what occured in rural America. Histories of the National Mall provides tourists and site visitiors “compelling stories and primary sources that together build a textured historical context for the space and how it has changed over time.” Mapping the Gay Guides provides six decades worth of  insight on businesses and locations that were friendly to the gay community. 

Online mapping tools such as kepler.gl further demonstrate the ways in which digital mapping can illuminate historical questions and relationships. Kepler.gl has many features that enable the use of point, cluster, and heat maps along with the use of filters to demonstrate key aspects of information from uploaded data. Points maps can give us a basic understanding of what areas a researcher should focus on. Cluster maps can show us the density of data points and a general area of focus while heat maps can give data specifics on location. Kepler.gl also offers a category map and timeline feature to differentiate given data with categories and to demonstrate changes in the data over time. My original understanding of digital mapping included the idea that it could be used to conduct an analysis of geographic information. Tools such as kepler.gl have the ability to conduct data analysis and interpretation in various mapping styles and features.

Text Analysis with Voyant

Textmining allows you to use computer software to conduct an extensive quanitative analysis of text. Textmining is most useful in conducting an analysis of large corpora in a database or archive. Specifically, textmining can be used to search through text to quanitify how often a certain word appears in a digitized archive or material. Textmining tools can be used to examine patterns or trends in qualitiative data. Several projects that have utilized textmining include America’s Public Bible, Robots Reading Vogue and Signs40.  In the case of America’s Public Bible, textmining was used to perform an analysis of biblical quotations in US newspapers to determine trends in biblical references at different historical periods. Robots Reading Vogue was designed to evaluate beauty trends over time while Signs40 used textmining to determine changes in Signs’ feminist scholarship. Trends related to certain words, topics and themes can then enable a researcher to draw certain conclusions on the historical time period of study.

Free text mining tools like Voyant can be used to conduct textual analysis. For instance, you can upload links of textual information to Voyant as a dataset that will then be processed into a digital corpus. From there,  tools like Cirrus, Reader, Trends, Summary and Contexts can be used as visual interactives to find patterns or differences in the data. The dataset used for my exploration of Voyant was the WPA Slave Narratives.

I utilized all of Voyant’s given tools to compare the frequency of words in various states. Specifically, I compared the states of Alabama and Maryland to each other by seeing the distinctive words utilized in their interviews.  For instance, Alabama used distinct words like  didn’t (357), alabama (138), ain’t (213), don’t 182), ca’se (69), caze(104), couldn’t (103), i’s (93), i’se (92), dat’s (90). Maryland used distinct words like  bowie site. (17), baltimore (64), ellicott(11), cockeysville (11), arundel (9), annapolis (9), md (11), maryland (60), rezin(7), manor (6). From this analysis, I was able to conclude that Alabama’s distinct words referred to their unique dialect while Maryland’s distinct words referred to Maryland African American communities. In using Voyant, I was able to see that while textmining is useful in searching through large sets of data-it is imperative that a person is working in conjuction with the software to get rid of unnesessary “stop” words and to make sense of the words that are repeated throughout to draw historical conclusions.


Why Metadata Matters

Metadata is “structured textual information that describes something about the creation, content or context of a digital resource” (Jisc, 2014). Metadata enables items to be discoverable in a database or archive due to the field information provided. Researchers, patrons and digital humanists can use the metadata provided in common fields like title, subject, description, creator, date, format, type and location to find artifacts and documents.The common fields present digital humanists with a source’s context and descriptive infromation. Context and description are the most essential parts of metadata as they help digital humanists understand “the physical and digital origin, structure, and technical makeup” of a resource (Carbajal and Caswell, 2021, pg.1108 ). From this, digital humanists can improve their own understanding of their research and appropriately utilize primary and secondary sources in the digital humanities.

Additionally, metadata serves a purpose in maintaining an archive’s material infrastructure which can then aid the digital humanities as a whole. Maintaining infrastructure through the preservation of physical and digital records will feed into the ever changing architectural, technological, social, epistemolgical, and ethical structures of an archive (Carbajal & Caswell, 2021). Consequently, digital archivists can fullfill the needs of their digital users by adopting improved metadata standards to extinguish problematic metadata. The continued maintenance of material infrastructure has the power to place checks on the political, historical, and cultural biases of the archivist or archive in order to better satisfy the needs of a diverse population of digital users.

Tropy and Omeka can assist digital humanities practitioners in research organization and collaboration. Trophy is a software tool and unified system that enables researchers to manage and describe the image files of archival materials. Archival photographs can be saved and viewed for future reference within Tropy.  Specifically, common field information for resources can be saved within the software and organized into various projects and collections. Similarly, Omeka serves as a computer software that assists researchers in organizing their materials. Omeka also has interoperability which allows users to share Tropy’s archival metadata with a larger audience. For instance, I am now able to share my findings related to Service Guardian and Hamilton Beach cookware. Software like Tropy and Omeka enabled me to become more thorough with locating and writing the correct metadata. Since Omeka is a resource that can be shared with others, I wanted to make sure that I was using the correct subject, name, title, and name authorities for my kitchen collection. I also wanted to develop enough accurate background knowledge on my kitchen items to provide the correct contextual and descriptive information. Fortunately, Tropy and Omeka enable users to follow the best practices in maintaining metadata by offering archival organization and information sharing. 

Market Research and American Business, 1935-1965 Database Review

Market Research & American Business, 1935-1965 Review

Market Research & American Business , 1935-1965 is a database that showcases original documents in the pursuit of knowledge related to the consumer boom of the mid-20th century.

Search

The site is researcher friendly as it provides a chronology, pop up glossary, an ad gallery and a “My Archive” feature. The chronology is related to mid-20th century consumerism, covering a timeline of 100 years. The site prides itself on its chronology tool even going so far as to state that its patrons can “view entries specific to a range of thematic categories, such as Inventions and Innovations, and Businesses and Brands.” The site also specifies that it is possible to search the database via keywords and then “create a printable list of the entries most relevant to your research.” The chronology tool provides its patrons with a list view option, histogram, navigation arrows, and filter options with category and timeline tabs. The pop up glossary allows users to define terms related to advertising, marketing, and market research. The ad gallery is a collection of advertising prints from the 1930s-1960s that can be filtered by Industry, Decade, Image Type, or Brand, and the companies. Researchers can also save their newly discovered resources in the “My Archive” feature of the site to revisit at a later time.

In regards to documents, they are filtered by type. Documents can be filtered as Letters, Memorandums, Pilot Studies, Proposals, Reports and Supporting Materials. All documents are assigned an industry in which they are associated. Industries are listed alphabetically and include Advertising, Electronics, Food and Drink and much more. Search directories are provided that enable keywords, companies and brands to be used in research. Original images can be viewed using the image viewing screen and by utilizing the magnification tools. The search engine “searches across all document-level metadata including bibliographic details, full text of printed material and selected additional editorial features.” The search engine can carry out a keyword search and a more advanced search. Further resources are also provided such as case studies, essays, and business biographies.

Date Range: 1935-1965

Publisher: Adam Matthew

Object Type: Documents and Images

Exportable Image: Yes

Facsimile Image: Yes

Full Text Searchable: Yes

History/Provenance:

The market research reports of Ernest Dichter, the most prominent consumer analyst and researcher of the time, are a pivotal part of the archive. Additionally, the database has collected an abundance of reports related to consumerism and the advertising industry of the historical time frame. Adam Matthew Digital Ltd is the publisher of the material while participating libraries include Hagley Museum and Library, Ernest Dichter and the Institute for Motivational Research, John W. Hartman Center for Sales, Advertising & Marketing History (Duke University), and the Advertising Archives.

Reviews:
“This file delivers amply on the vendor’s claim that it “provides a unique insight into the world of buying, selling, and advertising in pre- and post-war America.” It does more than that, with sometimes chilling psychosocial analysis that will successfully serve researchers in the areas of psychology, history, business, marketing, advertising, consumerism, gender studies, ethnic and minority studies, communications, sociology, American studies, philosophy, terrorism, and politics.” – Cheryl LaGuardia, Library Journal

“The vintage images match the aesthetic of the twentieth-century era. This database was visually enjoyable and informative for those who are interested in studying twentieth-century market trends, as well as some of the psychological motivations and behaviors of this era. The topics of reports range in product types and behaviors.”
-Anne Larrivee, Reference Reviews

Access: Requires an institutional login to access the database.

Info from Publisher: www.amdigital.co.uk

Other Info:
Images and documents can be downloaded as PDFs, printed, and photocopied. Additionally, digital items can be bookmarked and shared. That said, materials are restricted by copyright as long as items are not duplicated or used for profit but educational purposes. The site also states “none of the material may be published without first gaining permission from Adam Matthew and The Hagley Library.”

Citing:
According to Market Research and American Business, 1935-1965 database, scholars should follow the correct parameters for citation. Scholars should reference the document or image and the library holding the material. The copyright notice should be referenced. The bibliographic details of documents can be exported to RefWorks and EndNote.


A Guide to Digitization

Digitization can only go so far in capturing all that an artifact has to offer so it is important to consider the “digitization, rendering and meaning behind a re-presentation” of an image (Conway). To a certain extent, digitization can capture the color, size, shape, sound and texture of an item. Digitization is mostly dependent on the type of digitization that is used to archive an item. Videography works well in capturing the sound of an item, size, color, and texture to offer a more dynamic visual experience. In comparison, photography works well for capturing a “simplistic” image of an artifact. However, photographs can be dynamic in their scope as there are many decisions relating to spatial resolution, tone reproduction and color space. More than one photo of an item may be needed to capture more of what an artifact has to offer. Thus, multiple photographs or a collection can capture more characteristics related to the size, shape and color of an image. As stated by Paul Conway, “building collections of photographs through digitization is fundamentally a process of representation” which is then without a doubt a “far more interesting and complex than merely copying them to another medium.”  However, more than one form of digitization may be needed to capture all the characteristics an artifact has to offer. Meaning is a very important aspect of digitization and one form of digitization may place limitations on the intentions behind a visual image. According to Melissa Terras, digitization is quite “commonplace in most memory institutions, such as libraries, archives, and museums” which means digitization will only grow more and more popular as time goes on. Consequently, multiple approaches to digitization are needed in order to enable artifacts to serve educational and artistic purposes that preserve the digitized cultural heritage.

Government Publication Office (GPO) Resource

The Government Publication Office (GPO) is a resource that can be used to view works that are created by agencies in the United States Government. Their terms of service are the following. The site houses publications from all three branches of the Federal Government. The site focuses on public access, content management and the digital preservation of government documents. They have collections of Bills and Statutes, Budget and Presidential materials, Congressional Committe materials, Executive Agency publications, Judicial Publications, Proceedings of Congress and General Congressional Publications and so on.

Unsplash Resource

Unsplash is a great site to use for public domain images. Their terms of service are as follows. Accordingly, Unsplash advertises itself as a location that houses freely usable images. It first began as a Tumblr blog and it has now evolved into a site that houses over 3 million images. Unsplash’s license also states that all photos can be downloaded and used for free. They can be utilized for commercial and non-commercial purposes and no permission is needed but they would appreciate attribution. Additionally, Unsplash has many  images curated for educational purposes.

Digital humanities issues, tools, and resources